
Over Powered Investing | Day Trading
- I help people to Gain a Mechanical Edge
- 1-2 High Quality Trades Spending 15 Min/Day
- Wanna Learn Mechanical Strategy👇🏻
Recent Posts
Two Sides of Liquidity 👇🏼 Understanding liquidity is the key to mastering the markets, but most traders only think of it in terms of reversals. Here’s the truth: liquidity can trigger reversals AND create momentum for continuation. It all depends on the market context. Let’s break it down. Reversal liquidity: Reversals happen when key liquidity levels get swept, especially in ranging markets or when price moves against the trend. For example, during an uptrend, a sweep of a recent low often signals a reversal back up. This setup works best when the market is consolidating or in a clear pullback phase. Continuation liquidity: When price sweeps a level but doesn’t create a reversal, it’s often building momentum for a breakout. Think of it like fueling the next big move in the same direction. This happens when the market is trending. Don’t jump in too early—waiting for confirmation is key to avoiding losses. The problem with subjective liquidity: One of the biggest mistakes traders make is marking random lines on their charts and calling them liquidity levels. Subjective levels lead to confusion and missed trades. Your levels must be objective and simple enough for anyone to understand. How to spot objective liquidity: The most reliable levels are tied to time and universally recognized. Focus on these: - Daily highs and lows: Ideal for day traders to catch price reversals and quick moves. - Weekly highs and lows: Perfect for swing traders looking for key turning points or momentum continuation. - Monthly highs and lows: Best for long-term setups and major market moves. Pro tip: These levels are visible to everyone, including institutions, making them high-probability zones for price action. Bonus tip: Trading becomes much simpler when you focus on mechanical, time-based liquidity levels. Stop overcomplicating your charts and start using these strategies for more consistent results. If this post has been helpful, comment “Tutorial” for a free training on how to build a mechanical edge and scale your trading to 6 or 7 figures without complex analysis or being glued to the charts.

Two Sides of Liquidity 👇🏼 Understanding liquidity is the key to mastering the markets, but most traders only think of it in terms of reversals. Here’s the truth: liquidity can trigger reversals AND create momentum for continuation. It all depends on the market context. Let’s break it down. Reversal liquidity: Reversals happen when key liquidity levels get swept, especially in ranging markets or when price moves against the trend. For example, during an uptrend, a sweep of a recent low often signals a reversal back up. This setup works best when the market is consolidating or in a clear pullback phase. Continuation liquidity: When price sweeps a level but doesn’t create a reversal, it’s often building momentum for a breakout. Think of it like fueling the next big move in the same direction. This happens when the market is trending. Don’t jump in too early—waiting for confirmation is key to avoiding losses. The problem with subjective liquidity: One of the biggest mistakes traders make is marking random lines on their charts and calling them liquidity levels. Subjective levels lead to confusion and missed trades. Your levels must be objective and simple enough for anyone to understand. How to spot objective liquidity: The most reliable levels are tied to time and universally recognized. Focus on these: - Daily highs and lows: Ideal for day traders to catch price reversals and quick moves. - Weekly highs and lows: Perfect for swing traders looking for key turning points or momentum continuation. - Monthly highs and lows: Best for long-term setups and major market moves. Pro tip: These levels are visible to everyone, including institutions, making them high-probability zones for price action. Bonus tip: Trading becomes much simpler when you focus on mechanical, time-based liquidity levels. Stop overcomplicating your charts and start using these strategies for more consistent results. If this post has been helpful, comment “Tutorial” for a free training on how to build a mechanical edge and scale your trading to 6 or 7 figures without complex analysis or being glued to the charts.
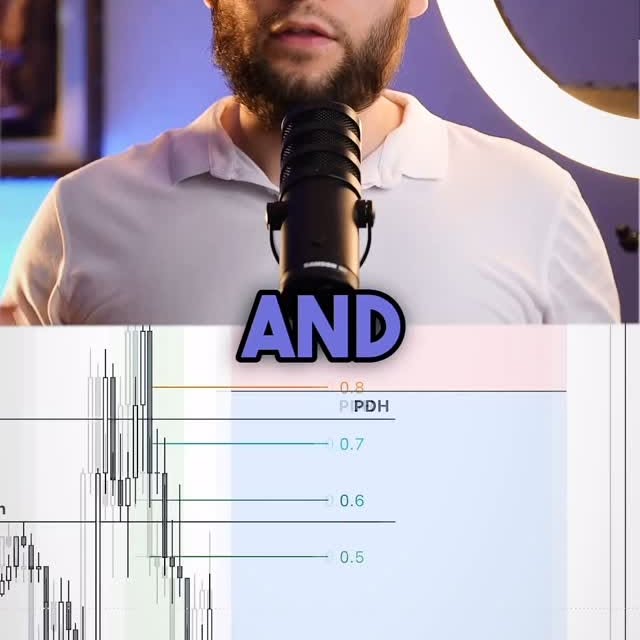
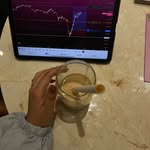
You have to try to trade this pool of liquidity. These places hide enormous amount of Stop Losses. Learn How to Win 1-2 High Quality Trades a Day without guessing your trades. Comment a word “Guide” and I will send you Free Training!
30 days and one mindset shift—that’s all it took to go from second-guessing every trade to feeling 100% confident with every buy or sell. I used to overanalyze, jump between strategies, and fear losing money. If this sounds familiar, let me share what changed everything for me: I stopped focusing on winning every trade and started focusing on following my plan. Here’s the truth: No trader wins every time, not even the pros. The difference? Discipline. I created a strict risk management plan and stuck to it, no matter what. Instead of chasing profits or revenge trading after losses, I focused on minimizing risks and letting my winning trades grow. The real breakthrough happened when I detached my emotions from the outcome of each trade. Wins and losses are part of the game, but execution is what matters most. Consistency, not perfection, is what leads to success. Trading is a marathon, not a sprint. By trusting the process and following my plan, I found clarity, confidence, and results. If you’re tired of second-guessing your trades, start by shifting your mindset. Focus on discipline and execution, and watch your confidence grow. Save this post to remind yourself of the power of consistency and follow for more trading insights.
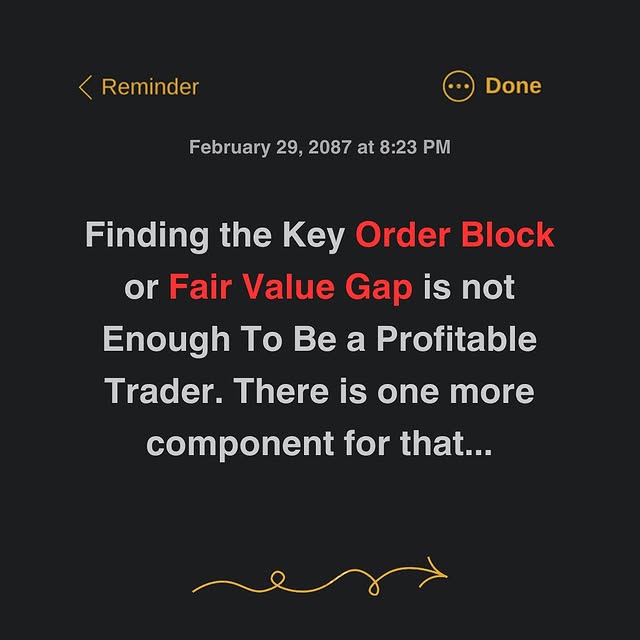
Finding the key order block or fair value gap isn’t enough to be a profitable trader. There’s one more critical component you need to master: market direction. Many traders think identifying OBs or FVGs will guarantee profitability. But without knowing the market’s trend, marking random levels on a chart is meaningless. To be a profitable trader, you must answer these two questions: 1. What is the market direction? 2. Where is the optimal entry point? While OBs and FVGs answer the second question, let’s dive into how to identify market direction effectively: Market Structure The first step to determining direction is reading the market structure, which involves analyzing highs and lows. - Uptrend: Higher highs and higher lows. - Downtrend: Lower highs and lower lows. - Range: No consistent direction in price movements. Trading the Trend Once you know the market’s direction, trade in alignment with it. This alone can increase your win rate by up to 60%. Now, let’s simplify the process with tools that make identifying trends easier. Set of EMAs Using moving averages like 20, 50, and 200 EMAs helps confirm trends and market conditions: - 200 EMA: Identifies the major trend. Curving up = bullish, curving down = bearish, flat = range-bound. - 50 EMA: Signals a healthy trend. - 20 EMA: Indicates a strong trend. Most of the time, price respects these EMAs, so they’re great confluence tools when finding OBs or FVGs. Key Takeaway Trading isn’t just about finding entry points; it’s about aligning entries with the market’s direction. Mastering trend identification with market structure and EMAs will improve your accuracy and confidence. Save this post and follow for more actionable trading strategies. Comment «MS» to get a free training on taking 1-2 high-quality trades a day without guessing or overcomplicating.

How to become a Funded Trader in 30 Days. Learn How to Win 1-2 High Quality Trades a Day without guessing your trades. Comment a word “Help” and I will send you Free Training!
Trading random order blocks won’t make you profitable, but this tweak can change everything. Many traders mark random buy-to-sell or sell-to-buy candles and call them order blocks, but this guesswork leads to losses. Here’s how to refine your approach and 3x your win rate with order blocks. To trade profitably, you must master two things: where the price is going and where to find optimal entries. While order blocks are great for pinpointing entries, using them effectively requires a structured method. Here’s how to do it right: New Highs/Lows Only focus on fresh impulses that create new major highs or lows. These moves confirm the trend’s strength and direction. Without this confirmation, your order block is less likely to hold. Strong Impulse The impulse leading to your order block should be strong, ideally with multiple imbalances (or fair value gaps). This indicates trend strength and adds confidence to your entry. Golden Zone The best order blocks align with the Fibonacci golden zone. Draw fib levels on the impulse and look for blocks around the 60-80% retracement levels. This helps filter false blocks and increases accuracy. Safe Stop Loss Instead of relying solely on order blocks, consider using fib levels for entries. This approach offers high R:R with a better win rate, improving both your profitability and psychology. Place your stop loss just beyond the fib levels to keep your trades safe. Key Takeaway Random order blocks don’t work, but combining structured order block identification with Fibonacci retracements can dramatically improve your results. Save this post and follow for more actionable trading tips. Comment “OB” for a free training on how to take 1-2 high-quality trades daily without guessing or overcomplicating your strategy.
I lost over $10,000 on five trading courses… but this free resource taught me everything I needed to win. This free guide breaks trading down to the basics. It teaches 3 simple entry models that every top trader uses. These models are like a cheat code—they work with any trading strategy, and they’re the key to finding good trades. Here’s the crazy part: you’re probably already using one of them, but you’re doing it the wrong way. Don’t waste more time or money guessing. These 3 entry models will help you trade better and smarter. Comment the word Lesson, and I’ll send you the link for free.
Day Trading Strategy that will make a Funded Trader in 2025 Learn How to Win 1-2 High Quality Trades a Day without guessing your trades. Comment a word “Pips” and I will send you Free Training!
Looking for Equal Highs and Lows won’t show you where the hidden liquidity is, but this will... Most traders think liquidity is found at equal highs and lows. But drawing random lines on your charts doesn’t give you a clear, mechanical way of spotting it. Let me show you a better method. The best way to spot liquidity pools is to focus on key levels tied to time. Real liquidity is hidden beyond the highs and lows of sessions, days, and weeks. These levels are universal, which means you can always spot them with precision. Here’s how each works: Sessions This method is perfect for scalpers. By focusing on session highs and lows, you can trade liquidity grabs and reversals on lower time frames like 1-3 minutes. This approach works great if you want quick, high-quality trades. Daily Highs/Lows For day traders, daily highs and lows hold the majority of liquidity. In ranging markets, these levels often cause reversals. In trending markets, they act as manipulation zones for counter-trend trades. Use the 15-minute time frame to catch sniper entries. Weekly Highs/Lows Swing traders will benefit from focusing on weekly highs and lows. These levels contain significant liquidity and can highlight key price reversals within the week. Use the 4-hour time frame for precise entries in both ranging and trending markets. Why this works: These levels are not random—they’re recognized by institutions and often cause price reversals. By using this approach, you’ll always have a mechanical and reliable way to spot liquidity. If you found this valuable, make sure to save this post and follow for more tips like this! Follow and comment “Pips” to get a free training on how to take 1-2 high-quality trades a day without guessing or overcomplicating your strategy.

Profitable Breakout Pattern that will make you funded in 2025 Learn How to Win 1-2 High Quality Trades a Day without guessing your trades. Comment a word “Tutorial” and I will send you Free Training!
Just 15 Min a Day and one Breakout pattern will make you a profitable trader! Learn How to Win 1-2 High Quality Trades a Day without guessing your trades. Comment a word “Pips” and I will send you Free Training!
Similar Influencers

Ahmed Ali

Amol Kumbhar

SHRINIVAS YAMAWAD

MARKET KING 👑
lipi trades📈🫀

Traders Empires

Liquidity Trading

Trade | Money | Trading

warzonetraders | Grind never stops

Finastic Trading
Rohit Meena

ICT Break down 👁️

ICT TRADING UNIVERSE

WALLTRADINGFX
bullionchart

Saksham Gajree | Psychology Trading

Hazzim Mazihan

Stocktwits India 🇮🇳

CK Capital

FX queen

Gus | Day Trader 💰

Vignesh S

Vincenzo | CEO e Formatore di Unlimited LLC

Nasif Mugerwa

Trade | Forex | Crypto | Technical Analysis

Ander Godwin

Malika
Elliott wave / Harmonic

Forex Trader